Magnetics
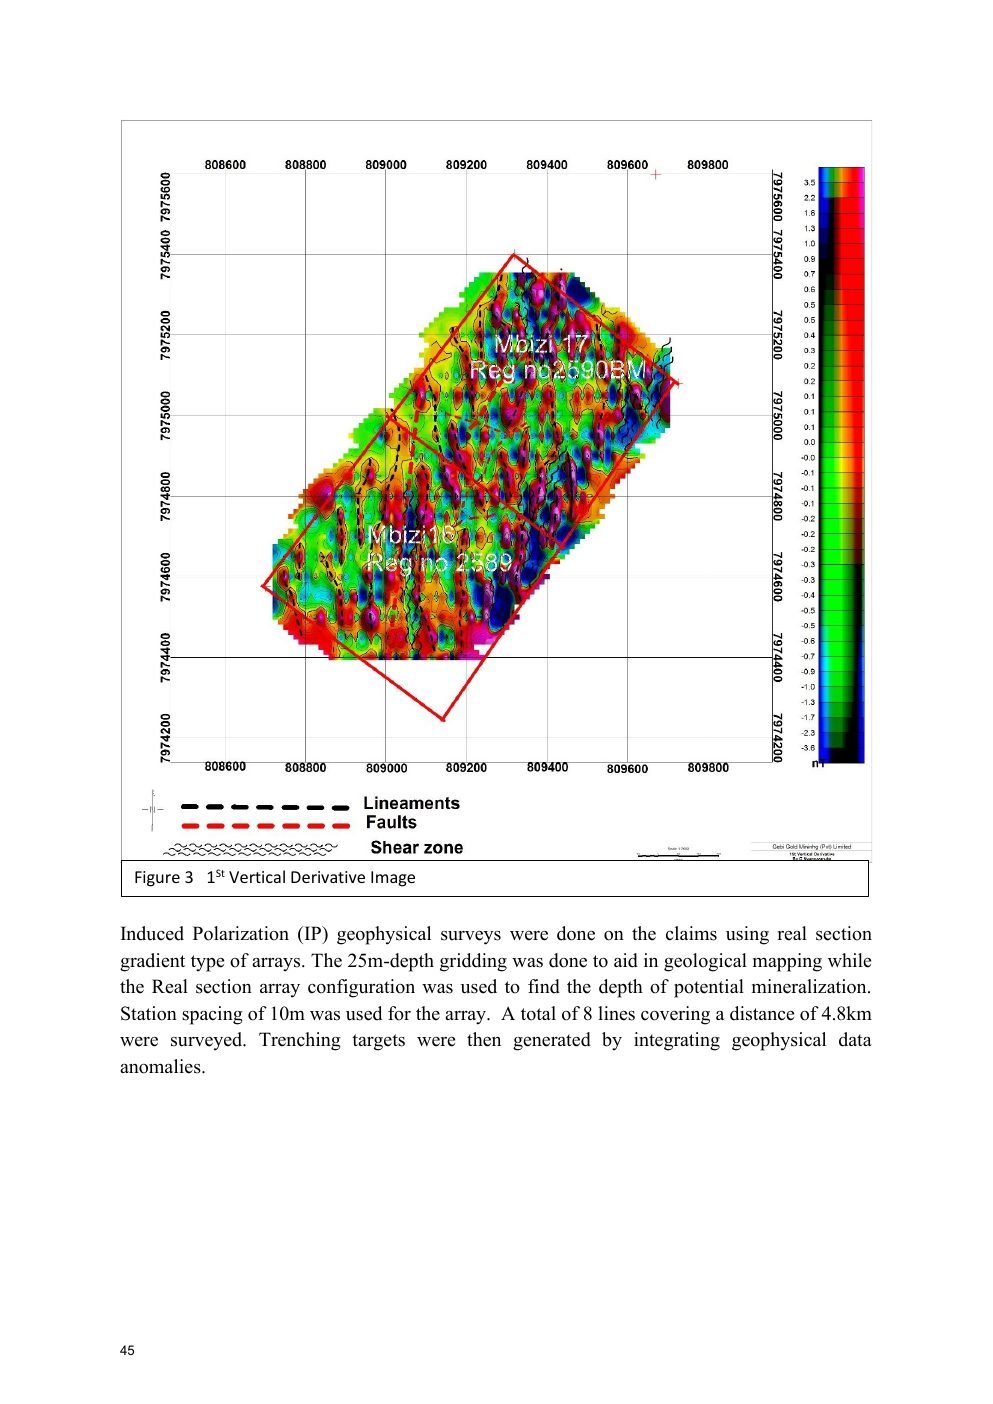
40 ground-magnetic lines covering 20 km were surveyed at 50 m line spacing in the later Geoprobe program.
An investor-facing overview of Gebi Gold Mining's Kadoma claims, built from the project's magnetic survey, induced-polarization work, trenching and laboratory assay documentation.
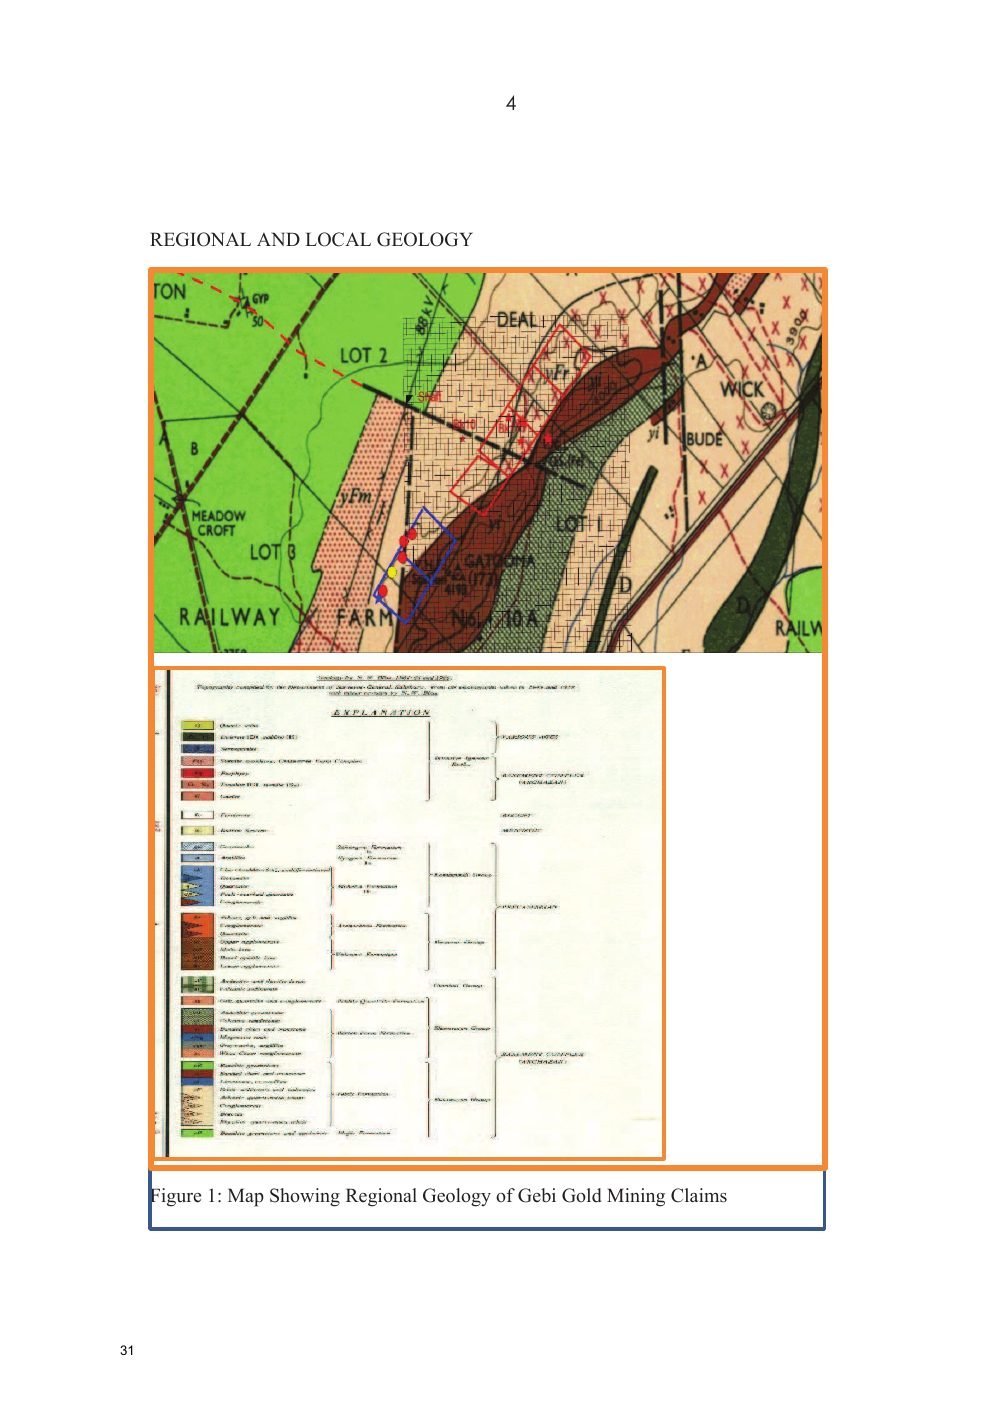
The Geoprobe report places the claims in the Midlands greenstone belt, close to the Midlands Deformation Zone, described as a sheared contact between the greenstone belt and Rhodesdale gneiss. Local geology includes rhyolitic quartz-mica schists, iron formation, sericites and meta-basalt greenstone.
40 ground-magnetic lines covering 20 km were surveyed at 50 m line spacing in the later Geoprobe program.
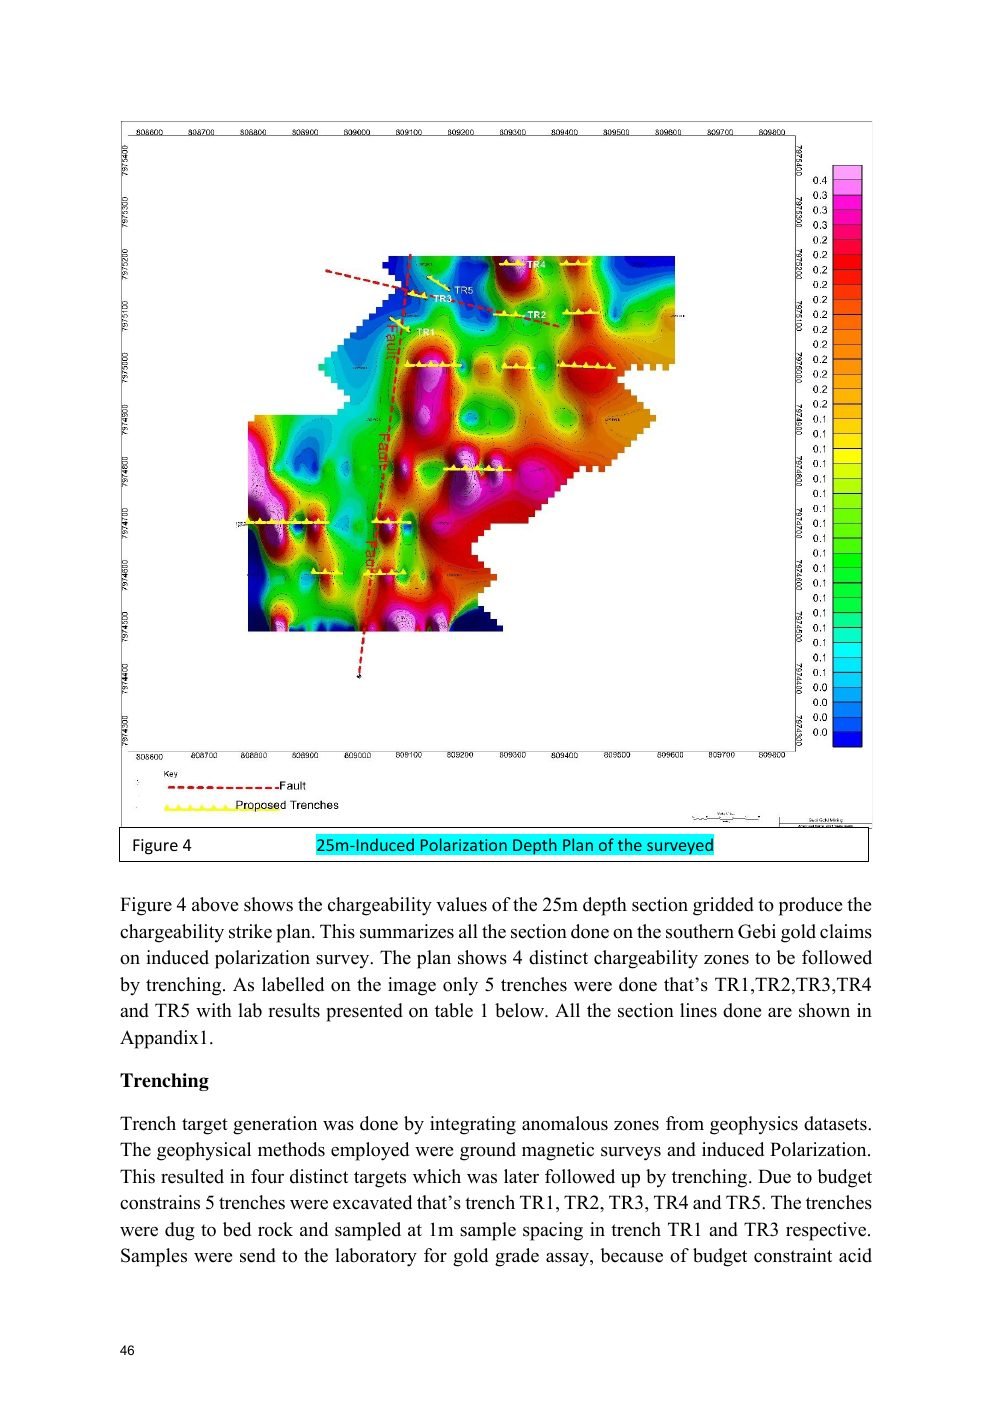
8 IP lines covering 4.8 km, using 10 m station spacing; 25 m depth gridding supported geological mapping and target definition.
Four distinct chargeability zones were identified by integrating magnetic and IP anomalies.
Five trenches—TR1 to TR5—totaling 207 m were completed, with TR1 and TR3 sampled at 1 m spacing to bedrock.
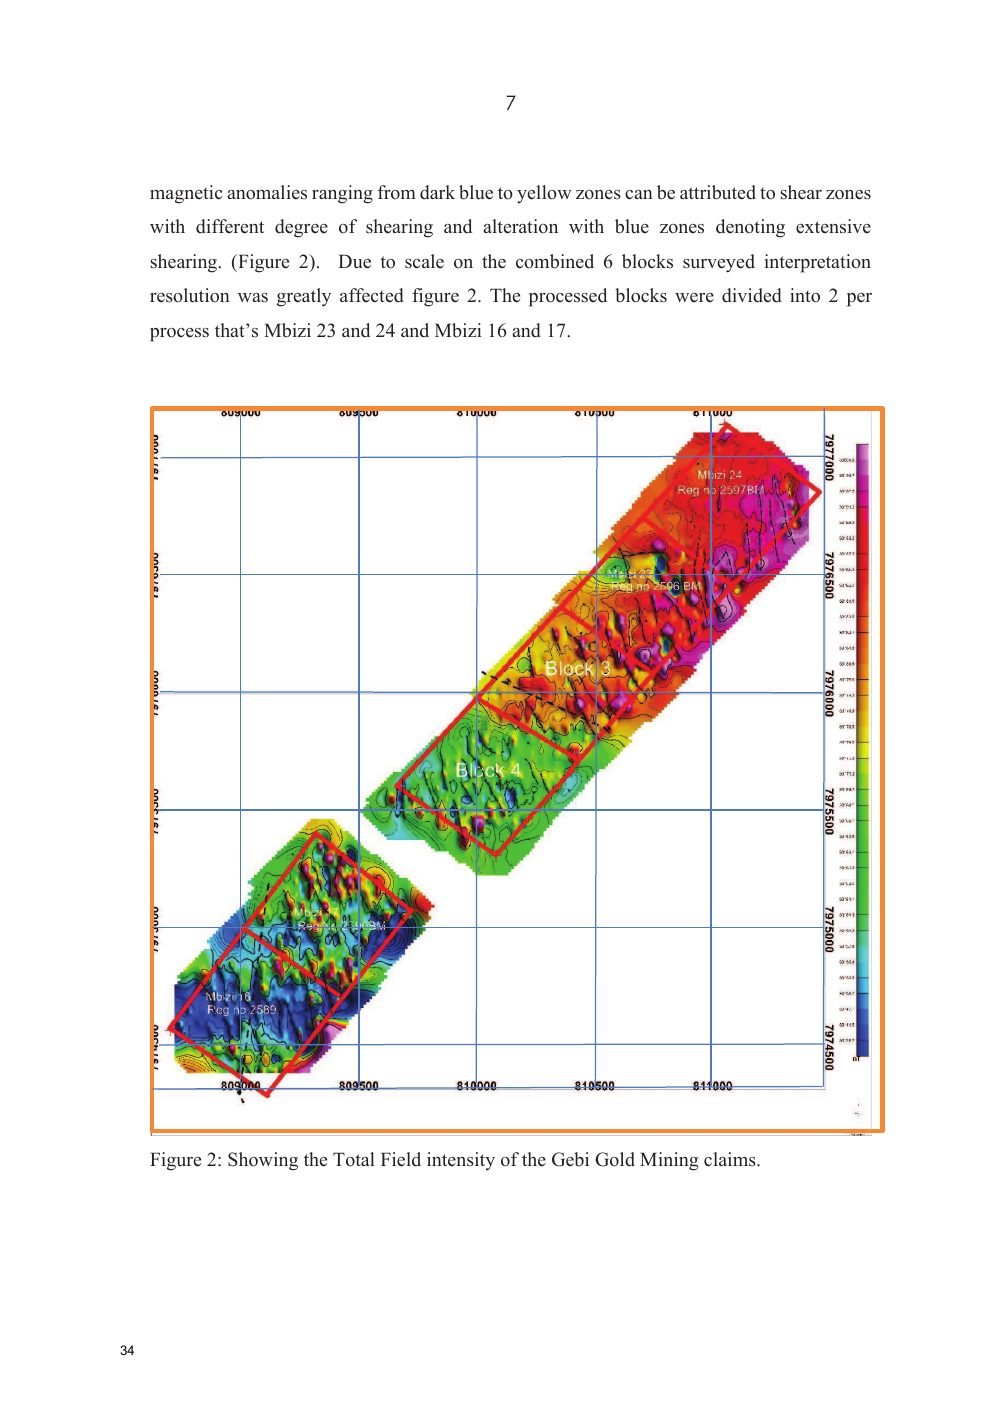
Geo Hezel Geophysical Consultancy was assigned to survey the Kadoma claims. The report describes NW–SE magnetic lineaments coinciding with sheared sericite schist and banded iron formation, interpreted as prospective settings for gold mineralization.
Total-field data show NW–SE high-intensity anomalies of approximately 30,191–31,200 nT, low anomalies of approximately 30,130–30,171 nT, and a moderate-high range of approximately 30,172.7–30,190 nT. Low magnetic zones were interpreted as shear zones with varying alteration intensity.
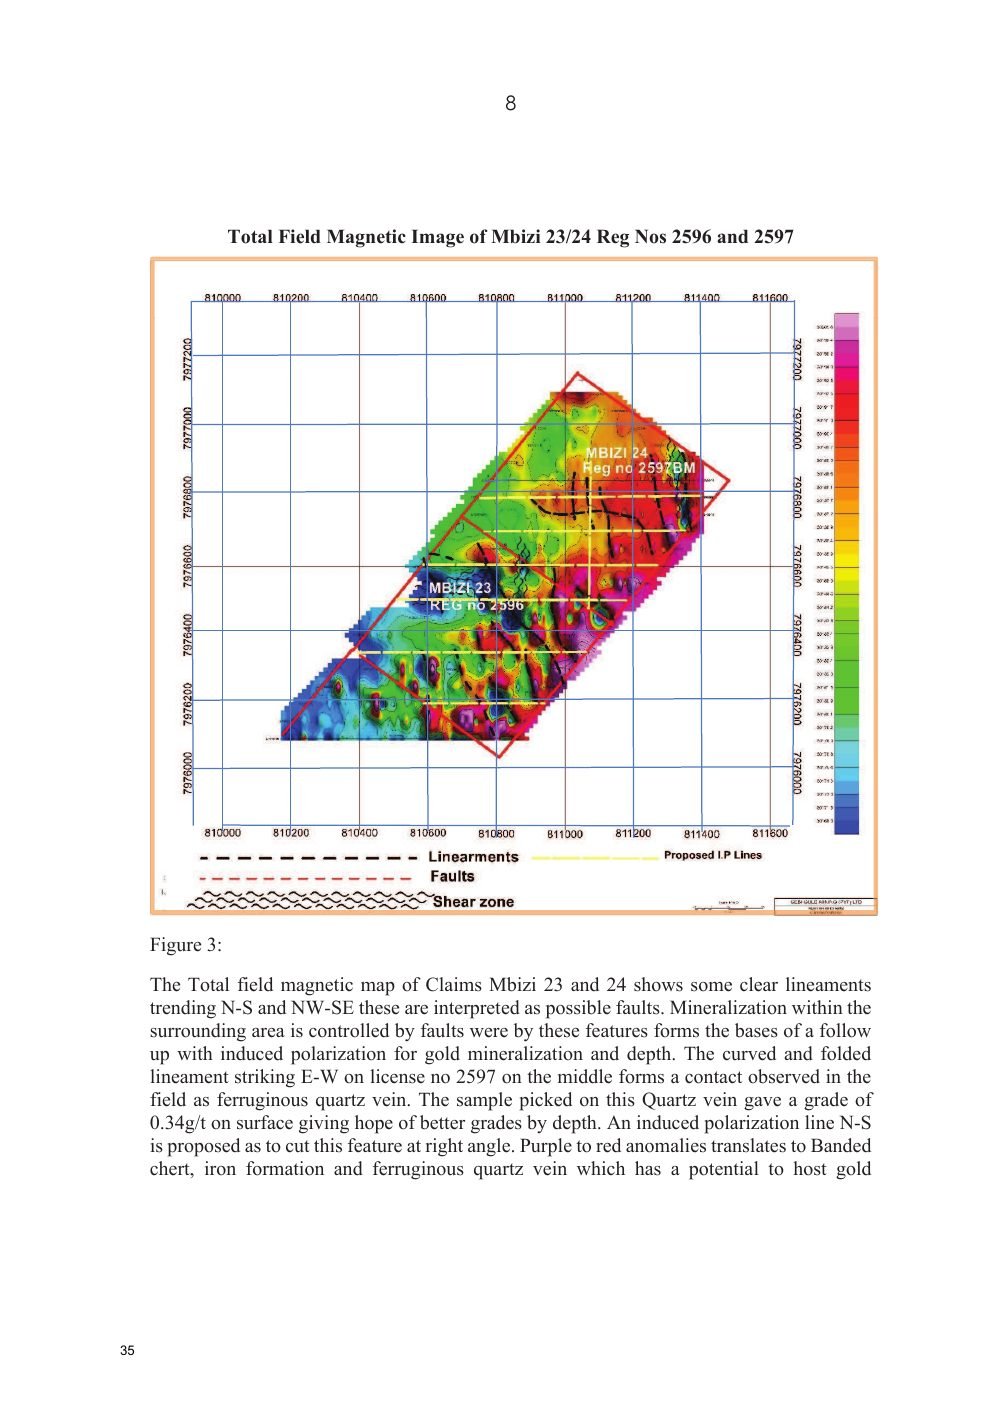
N–S and NW–SE lineaments were interpreted as possible faults. An E–W curved/folded lineament on licence 2597 corresponds to a ferruginous quartz vein; a surface sample reported 0.34 g/t Au. IP follow-up was proposed across the feature.
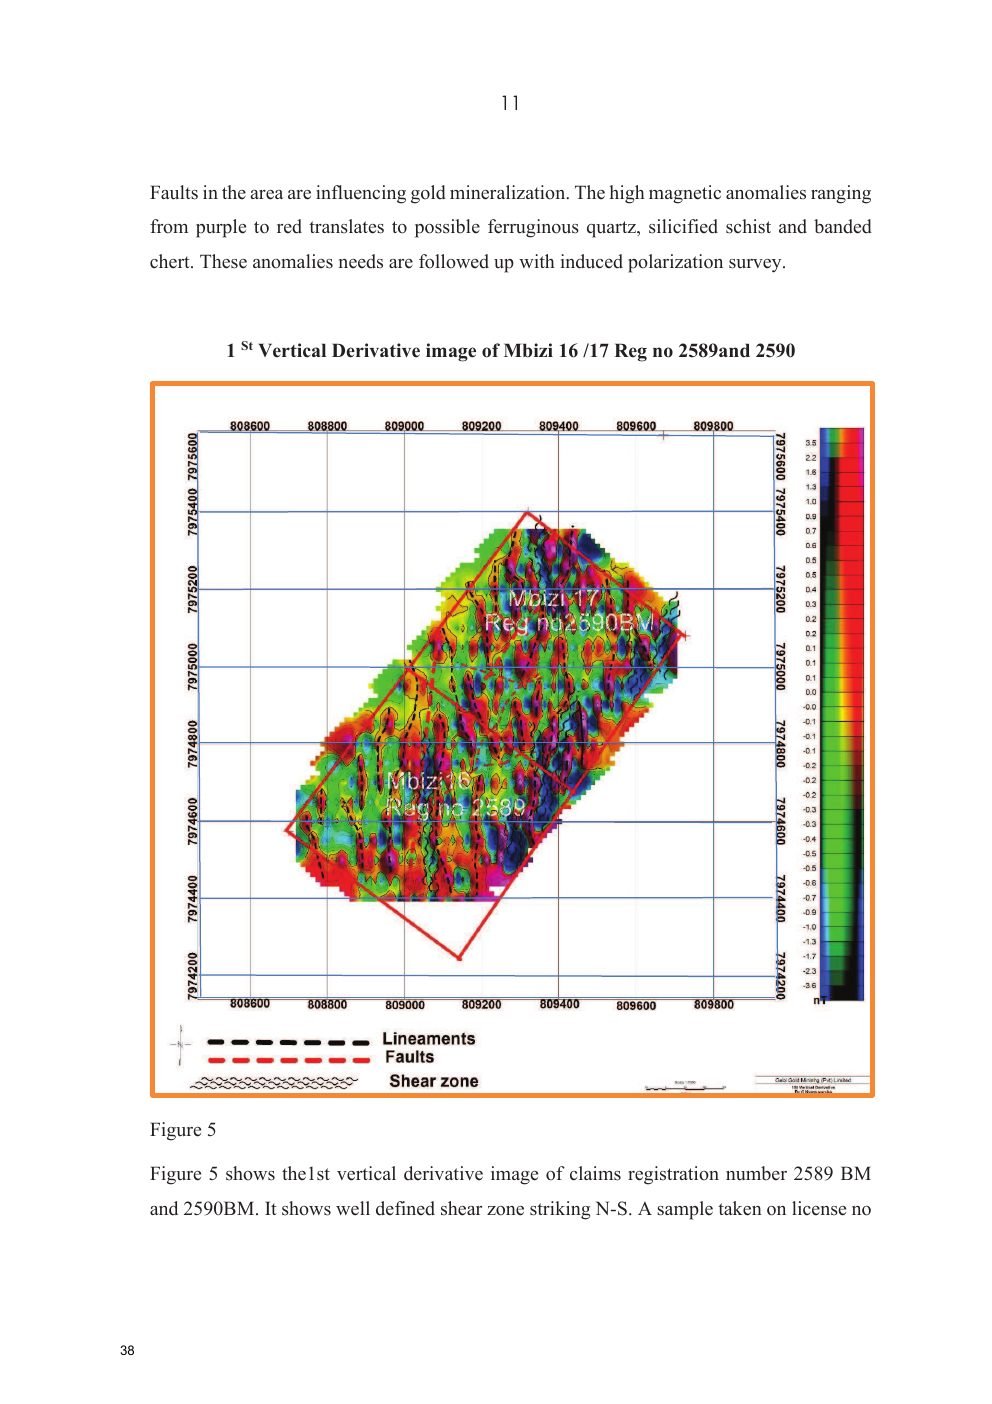
Several shear zones were interpreted on registration 2589BM, with N–S magnetic highs truncated by possible E–W faults. A surface sample at coordinate 35K 809060 / 7974920 reported 0.41 g/t Au. The report recommended IP follow-up.
The 25 m IP chargeability plan defined four target zones. Targets combined low magnetic response, high chargeability and low resistivity spatially associated with sheared greenstone, sericite and rhyolite contacts.
Magnetic and IP anomalies are exploration indicators. The reports themselves recommend follow-up trenching, sampling and further work to establish continuity and grade.
The Geoprobe report states that acid digestion was used recommends fire assay for the sulphide-hosted gold setting. It reports initial anomalous results of about 0.20–0.87 g/t and says deeper re-sampling improved some results up to 1.5 g/t.
| Sample | Au (g/t) | Sample | Au (g/t) |
|---|---|---|---|
| TR1/SHAFT | 0.58 | GB 1 | 0.19 |
| GB 2 | 0.24 | GB 3 | 0.69 |
| GB 4 | 0.91 | GB 5 | 0.74 |
| GB 6 | 0.84 | GB 7 | 0.41 |
| GB 8 | 0.38 | GB 9 | 0.43 |
| GB 10 | 0.43 |
Received: 21 Jan 2024 • Analysed / reported: 23 Jan 2024 • Material: Rocks • Method: Acid digest with AAS finish • Element: Au. QC references shown: STD 1 (1 ppm) returned 1.01; blank solution returned 0.00.
The project information sheet elsewhere in the supplied file states “106 analyzed + drilled sample 25 = total 131 sample.” This is a project-level summary and is separate from the 92 trench-result rows and the 11-sample Final Assay Certificate reproduced in the geology/lab sections.
These images are reproduced from the supplied project document so investors can connect the written interpretation to the underlying maps, sections and field evidence.
The exploration sequence has moved from structural mapping to IP target definition, trenching and assay. The reports identify sheared, silicified and sulphide-mineralized greenstone as the principal mineralized setting and recommend additional trenching/follow-up to test IP anomalies and establish continuity.
Structural control: faults and shear zones are repeatedly identified as important exploration controls.
Geophysical convergence: targets were selected where magnetic and IP responses overlap with mapped geology.
Assay evidence: gold is reported in surface/trench samples, with deeper re-sampling described as improving some values.
Next technical step: additional systematic trenching, drilling and appropriate assay work are needed before any resource/reserve conclusion.
West View, Kadoma, Zimbabwe
Mr. Khimji Halai
Managing Director